
Newspaper website page performance is still poor, have we given up?
A speech describing the “State of Newspaper Website Performance” would ironically be very fast. “The state of the newspaper web is slow, very slow.” End of speech.
This isn’t a new problem. But it is still a big problem. Last week, as part of a research project at the Missouri School of Journalism, we audited 75 article pages from among the largest daily newspaper chains.
The average “speed index” score from those article pages:
Speed Index (0–100% scale)
Desktop: 21%
Mobile: 9%
The tests utilized Google’s PageSpeed API to automate the report and considers “50%” to be web-average performance. So, if the industry doubled or tripled the performance of its websites, we would almost be average.
Page performance is not actually the focus of our research. That topic has been covered before, including by Barrett Golding who looked at the issue during a 2015 fellowship here at the Reynolds Journalism Institute. But, in the process of gathering and confirming a list of news site URLs, updating ownership records and gathering other basic information, a few metrics jumped out immediately.
- Of 1,250 daily newspaper sites tested, 79% now support HTTPS secure connections.
- 32% of daily newspaper sites are using the BLOX CMS from TownNews, 15% use WordPress, 13% Newscycle, 10% Gannett’s Presto and 5% Drupal. (There are other popular commercial and bespoke platforms, but we only looked at those five to start.)
- The average story page size is almost 6 MB on desktop and 4.6 MB on mobile, but 8–10 MB is not unusual on either platform.
Those metrics aside, our broader study plans to track the revenue and engagement strategies of daily newspaper sites and how those correlate to the various ownership groups — GateHouse, Digital First, Gannett, McClatchy etc.
The heavy lifting on the qualitative auditing of these sites is being done by Mizzou journalism graduate student Sam Manas. He will be cataloging the various revenue and engagement elements (ads, sponsored links, subscription offers, newsletter signups)present in articles, and where they are located on the page. The thesis being — news web pages have ostensibly limited screen real estate and the way we use that space reflects our priorities.
To get started and to get some sense of the state of things, we semi-randomly selected five article pages from the 15 largest U.S. news chains (by properties owned) and ran them through the Google PageSpeed tool. In addition, we added eight larger national and metro sites for comparison. The audits were run on both the desktop and mobile experiences — but NOT Google’s AMP pages which most of these sites also support.
In total, we tested 75 story pages from 75 different daily newspaper websites representing 23 different owners.
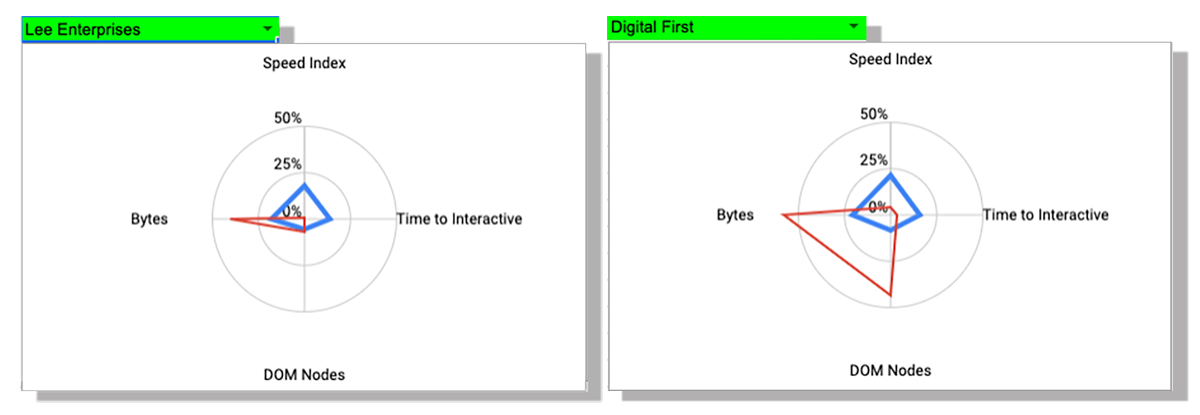
A full list of the sites, URLs tested, ownership group and scores are available here. The spreadsheet lets you filter by owner and see radar charts and small dashboards representing performance on Google’s scales.

I have been referring to Golding’s 2015 work at RJI to some extent in terms of data sources and methodology. But that project looked only at site home pages, and was focused on the individual site performance metrics of daily and weekly papers. Our current study is more interested specifically in daily newspaper article pages and broader ownership group strategies.
But as we are talking about page performance here today, a few caveats:
- I selected Speed Index, Time to Interactive, DOM Nodes and Bytes for our visualizations because they somewhat well represent both the perceived and technical components of page performance. But, your mileage may vary.
- Editor and Publisher’s Databook is the most complete source I have found, but it is missing some newspapers and websites. And, some active print newspapers with previous stand-alone domains are now published online as sections within a larger website. This can make the math a challenge.
- The data on ownership groups can be unreliable — due to the frequent buying/selling/merging of these companies. I double checked the properties used in the small sample here, but errors are possible.
- Running a page speed test a single time on one page is informational, but not always accurate due to a number of reasons. Looking at the aggregate for each group is more reliable — but re-running the test 3–4 times and taking an average for each page is better. We will do more of that in the future.
- We are using Google’s PageSpeed tool because, Google. Experts in page performance may argue specific metrics or methodology, but the goal here was apples-to-apples comparison. Feel free to run these pages through other analytics tools for further rigor. GTMetrix, YSlow, Web Page Test.
- Lab testing does not fully represent the real-world experience of your visitors. But you still need to test and work to improve that real-world experience.
- To be fair to the independent outlets (Boston, Dallas, New York, Seattle, Minneapolis, Washington) I re-ran their single-story results three times to get the average.
- Do you wonder why page speed is such a difficult conversation to get traction on in a media organization? The above are just a few reasons.
Methodology: Our list of newspapers sites and ownership is from the Editor and Publisher Databook. We ran an original list of URLs through a web spidering tool to obtain a report of active, redirected and broken addresses. From that we generated an updated list of URLs and a report of SSL-compliant sites. Subsequent spidering of those sites has been used to identify CMS vendors and to automate the Google PageSpeed reports. Leave a comment or tweet at me if you see errors. The CMS and SSL raw data is not included in the public Google Sheet referenced above. But it will be added in the near future.